Klara Jung · 22 October 2026
Examining Microclimate Variations Across Lindenridge Through Citizen Science Data Collection Programs
Researchers and local volunteers have tracked microclimate differences throughout Lindenridge by deploying low-cost sensors that measure temperature, humidity, wind speed, and solar radiation at street level, and these efforts reveal consistent patterns tied to vegetation cover, building density, and pavement materials. Data collection programs began several years ago when community groups partnered with regional universities to standardize recording protocols, while participants log readings at fixed intervals across residential blocks, parks, and commercial zones. The resulting datasets allow analysts to map how small-scale environmental factors produce temperature swings of several degrees within distances of just a few hundred meters.
Program Structure and Participant Roles
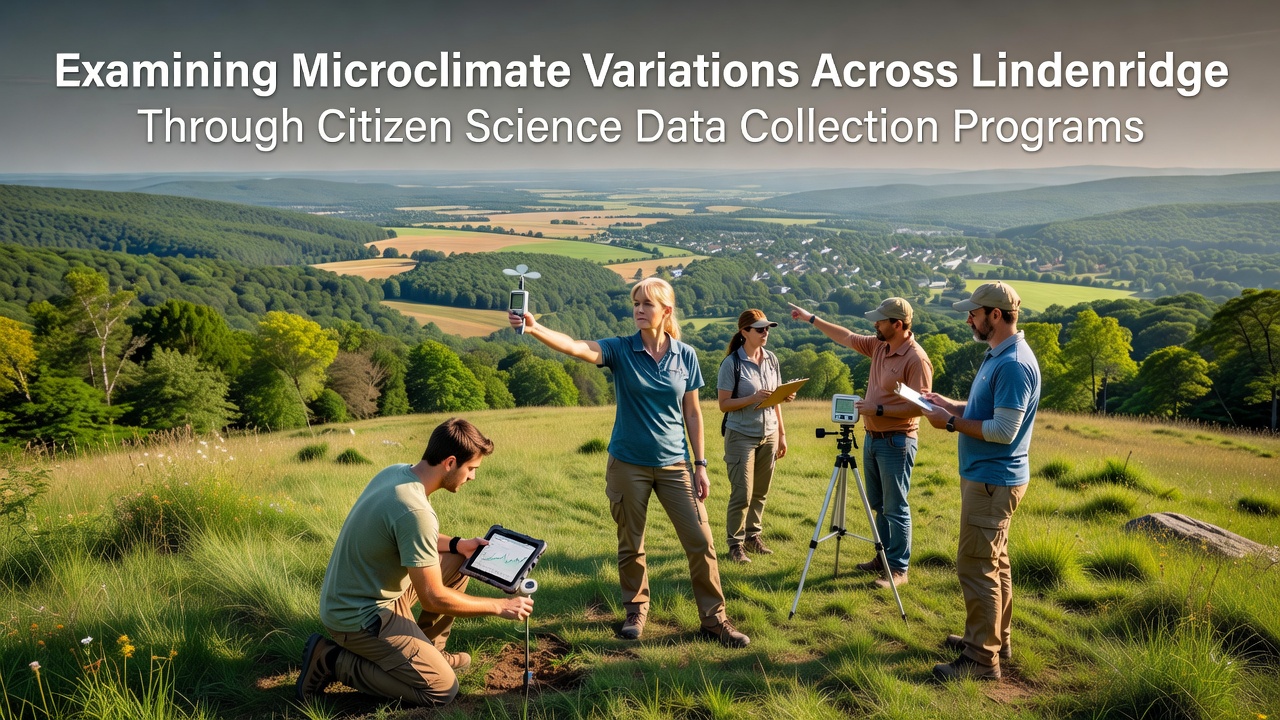
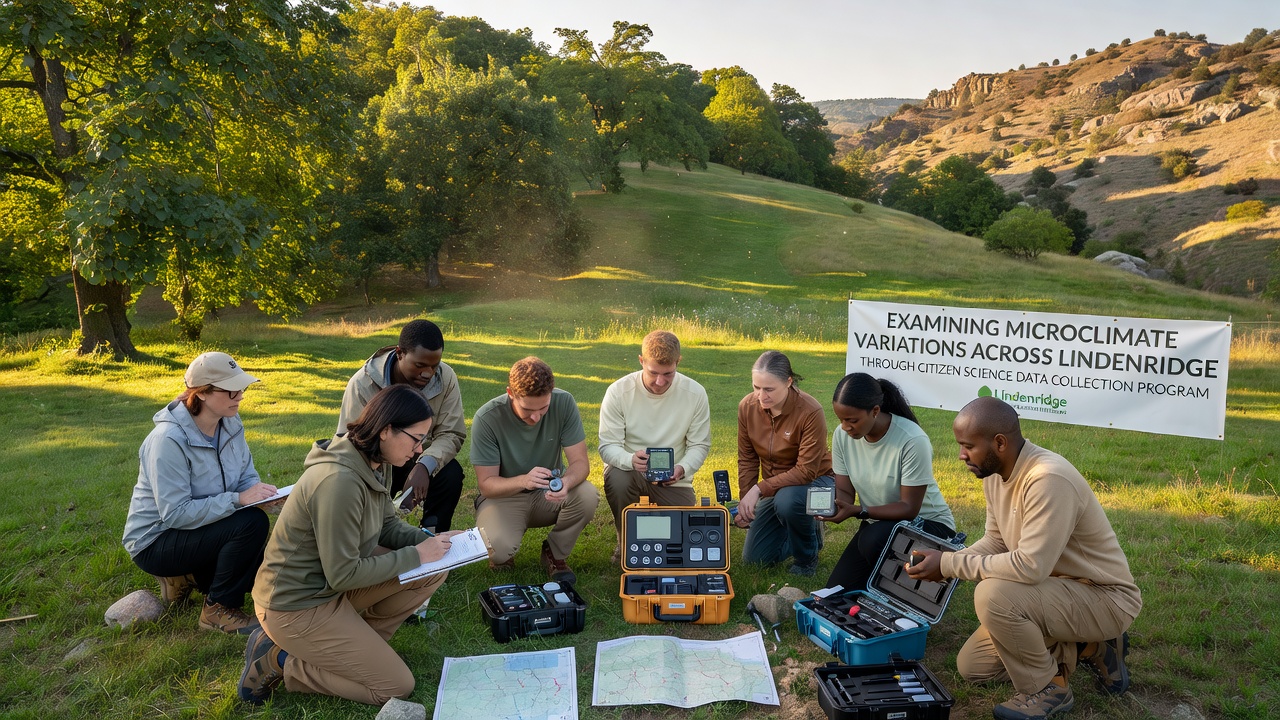
Coordinators divide Lindenridge into grid cells that each contain at least one sensor station maintained by trained residents, and volunteers receive calibration kits plus training sessions that cover proper placement away from direct heat sources. Monthly uploads feed into a shared database where quality-control algorithms flag outliers before researchers incorporate the records into spatial models. Participation has grown steadily, with over two hundred households contributing readings by early 2025, and organizers schedule additional training workshops to maintain data consistency across seasons.
Equipment includes compact weather stations that transmit via cellular networks, and some participants supplement these units with handheld infrared thermometers for surface temperature spot checks. Training emphasizes consistent timing, so most readings occur at dawn, midday, and dusk to capture daily cycles. Coordinators also distribute reference thermometers that volunteers cross-check against official stations operated by the National Weather Service, which helps align citizen datasets with broader meteorological records.
Observed Patterns in Temperature and Humidity
Analysis of accumulated records shows that areas with dense tree canopy maintain daytime temperatures up to four degrees Celsius lower than nearby paved corridors, while humidity levels remain higher under foliage because evapotranspiration adds moisture to the air. Commercial zones with extensive asphalt and limited green space register the highest afternoon peaks, and these hotspots persist into evening hours when surrounding residential blocks have already cooled. Observers note that wind corridors created by aligned building gaps reduce stagnation in certain streets, whereas enclosed courtyards trap heat and produce localized spikes that last longer after sunset.
Seasonal comparisons indicate that summer months amplify these contrasts because solar loading intensifies surface heating, whereas winter patterns flatten as reduced sunlight limits differential warming. Data collected during October 2026 will extend the multi-year record and allow researchers to test whether recent tree-planting initiatives have begun to narrow the observed gaps between hottest and coolest zones. Figures compiled so far point to measurable cooling effects where new plantings have reached sufficient canopy density, and continued monitoring will quantify the rate of change over successive growing seasons.
Data Integration With Broader Research Networks
Local teams share processed summaries with national citizen science platforms that aggregate similar projects from other urban areas, which enables comparative studies across cities of varying sizes and climates. According to resources from teh Environmental Protection Agency on citizen science approaches, standardized protocols improve interoperability between independent datasets and support larger-scale modeling efforts. Meanwhile, analysts cross-reference Lindenridge readings against satellite-derived land surface temperature products to validate ground observations and identify locations where finer-resolution data fills gaps left by orbital sensors.
University partners apply machine-learning techniques to interpolate values between sensor points, and the resulting high-resolution maps help urban planners evaluate proposed developments for their potential microclimate impacts. Reports generated from these models undergo peer review before release, and findings appear in regional environmental assessments that guide tree-planting priorities and pavement material choices. One study coordinated through a Canadian research institute examined similar urban sensor networks and confirmed that volunteer-collected data can achieve accuracy levels comparable to professional stations when calibration routines remain consistent.
Future Expansion and Monitoring Goals
Organizers plan to add soil-moisture probes and particulate-matter sensors to existing stations during the next phase, which will expand the scope beyond temperature and humidity alone. Grant funding supports equipment upgrades that improve battery life and data transmission reliability, while outreach campaigns target schools to involve students in data interpretation workshops. Continued growth depends on sustained volunteer engagement, and coordinators track retention rates to adjust training formats accordingly.
Conclusion
Citizen science programs in Lindenridge demonstrate how distributed sensor networks can document microclimate variations at scales that traditional monitoring misses, and the accumulated records provide planners with actionable detail for heat-mitigation strategies. Ongoing collections scheduled through October 2026 and beyond will strengthen trend detection while testing the effectiveness of recent interventions. Integration with national and international databases further extends the utility of these local measurements, showing how community-driven efforts contribute to wider scientific understanding of urban environmental dynamics.